DRAWING GRAPH CHARTS
OVERVIEW
Statistical data is best viewed using graph images. A possible way to integrate graphs into a Catalyst Application could result in creating a custom View for drawing the graphs requested. Today we will examine how such a task could look like.
Preparations
First we have to find and get warm with graph drawing libraries. There are plenty of them we can choose from on CPAN. My choice was Imager::Graph. This module offers the typical kinds of graphs (Area, Bar, Column, Horizontal, Line, Pie and StackedColumn) and allows customization of almost every parameter.
Imager::Graph depends on Imager, so
the same prerequisites apply here. Please see
Scaling images on demand
for a list of C-libraries required for installing Imager::Graph.
How to talk to the view
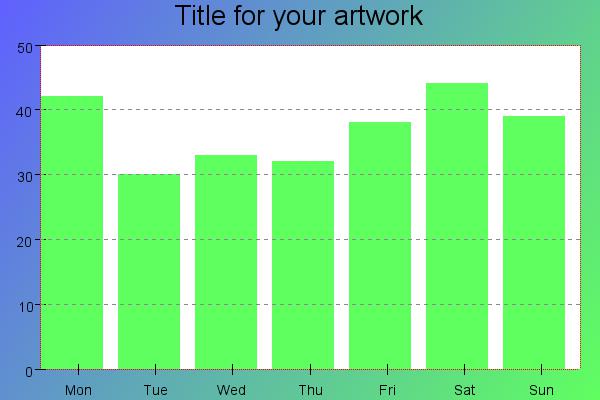
Inside any Controller we like to prepare some data which is forwarded to the view where the actual drawing occurs. A typical use case inside your Controller might look like this:
    sub some_method :Local {
        my ($self, $c) = @_;

        # ...get data somehow

        $c->stash(
            title  => 'Title for your artwork',
            width  => 600,
            height => 400,
            data   => [42, 30, 33, 32, 38, 44, 39],
            y_max  => 50,
            y_min  => 0,
            labels => [qw(Mon Tue Wed Thu Fri Sat Sun)],
        );

        $c->forward('View::Graph');
    }
Implementing the View
Add a view View/Graph.pm to your Catalyst Application and fill it with the code below. The tick arithmetic admittedly looks a bit awkward but it works well with negative and positive values and draws tick lines at multiples of a power of 10 depending on the minimum and maximum values.
    package YourApp::View::Graph;
    use Moose;
    use Imager::Graph::Column;
    use namespace::autoclean;

    extends 'Catalyst::View';

    sub process {
        my ( $self, $c ) = @_;

        # Please check this path!
        my $font = Imager::Font->new(file => '/Library/Fonts/Arial.ttf')
            or die "Error: $!";

        my $graph = Imager::Graph::Column->new();

        my $y_max = $c->stash->{y_max} // 20;
        my $y_min = $c->stash->{y_min} // 0;

        my $delta = 1;
        my $ticks = 9999;
        my $count = 0;
        while ($ticks > 10 && $count < 100) {
            $y_max = int(($y_max + (9 * $delta)) / (10 * $delta)) * (10 * $delta);
            $y_max = 10 if $y_max < 10;

            $y_min = int(($y_min - (9 * $delta)) / (10 * $delta)) * (10 * $delta);
            $y_min = 0 if $y_min > 0;

            $ticks = int(($y_max - $y_min) / (5 * $delta)) + 1;
            if ($ticks > 10) {
                $ticks = int(($y_max - $y_min) / (10 * $delta)) + 1
            }

            if ($ticks > 20) {
                $delta *= 10;
            }

            $count++;
        }

        $graph->add_data_series($c->stash->{data});

        $graph->set_style('fount_lin');
        $graph->show_horizontal_gridlines();
        $graph->use_automatic_axis();
        $graph->set_y_max($y_max);
        $graph->set_y_min($y_min);
        $graph->set_y_tics($ticks);
        $graph->set_image_width($c->stash->{width}  // 600);
        $graph->set_image_height($c->stash->{height}  // 400);

        my $img = $graph->draw(
            column_padding => 20,
            labels         => $c->stash->{labels},
            title          => $c->stash->{title} // 'Untitled',
            font           => $font,
            hgrid          => { style => "dashed", color => "#888" },
            graph          => { outline => { color => "#F00", style => "dotted" }, },
            fills          => [ qw(60ff60 a0a0ff) ],
        ) or die $graph->error;

        my $data;
        $img->write( data => \$data, type => 'jpeg' )
            or die "could not write image: $!";

        $c->response->body($data);
        $c->response->content_type('image/jpeg');
    }

    __PACKAGE__->meta->make_immutable;

    1;
The rendering time typically is not an issue. On my machine typical graphs are rendered in less than 100ms.
For More Information
See Imager::Graph for the full details.
Summary
Rendering graphs inside a View is not a very complicated task and can get triggered with just a few values from a Controller.
Author
Wolfgang Kinkeldei <wolfgang [at] kinkeldei [dot] de>